IMPORTANT • PREMA SNAPSHOT
Load-control groups A–J are showing Normal
For this V2 snapshot, PREMA’s public control page shows the Normal icon for every listed group. August control rules still depend on your rate group.
MY AQUIFER — Alliance Pilot v2
Your local view of the Ogallala Aquifer
Alliance, Nebraska • 69301
Same aquifer. Same evidence. Different lens.
For this V2 snapshot, PREMA’s public control page shows the Normal icon for every listed group. August control rules still depend on your rate group.
Key results include arsenic 5.47 ppb, nitrate-nitrite 5.23 ppm, and lead 0.997 ppb at the 90th percentile.
Water levels, PREMA status, water tests, NRD rules and nearby public groundwater context open on this page. Source links are secondary.
Aquifer Water Level
This is a public High Plains aquifer monitoring well, not a measurement directly beneath your home or field. A 2025 statewide report also identifies roughly 133 ft of predevelopment-to-2025 decline just north of Alliance in Box Butte County.
Irrigation & Power
August: alternating Group 169 may be controlled twice a week; Everyday Group 168 may be controlled every day except Sundays/holidays; Group 167 has no control in July or August.
My Tap
The annual summary states no violations occurred in 2025. The same report’s microbiological table separately notes one positive total-coliform sample in June and marks that row “Violations Present: Yes.” We show both statements rather than hide the discrepancy.
Groundwater Management
Quantity-management trigger framework: Phase II at ≥3 ft cumulative spring-static decline from the spring 1990 baseline; Phase III at ≥6 ft. Phase III makes regulated users subject to allocations.
Allocation varies by subarea. The 65-inch figure above is specifically the published 2025–2029 base allocation for subareas 4 and 6; it should not be assumed to apply to a field until its subarea is known.
Groundwater Quality Around You
Alliance’s public water supply is groundwater. Its 2025 report gives us a verified local groundwater-quality snapshot without pretending it is a test of your private well.
For a private-well subscriber, “around you” must stay honest: public area data can establish context, but only a sample from your own well can tell you what is in your well.
My Well
Use a nickname if you want. V2 then keeps the public context around your well in one place: aquifer level, Alliance-area groundwater tests and NRD management context.
My Water Tests
Your own laboratory test is the best evidence for what is in your well. Keep a private note here, then compare it with the public Alliance-area context.
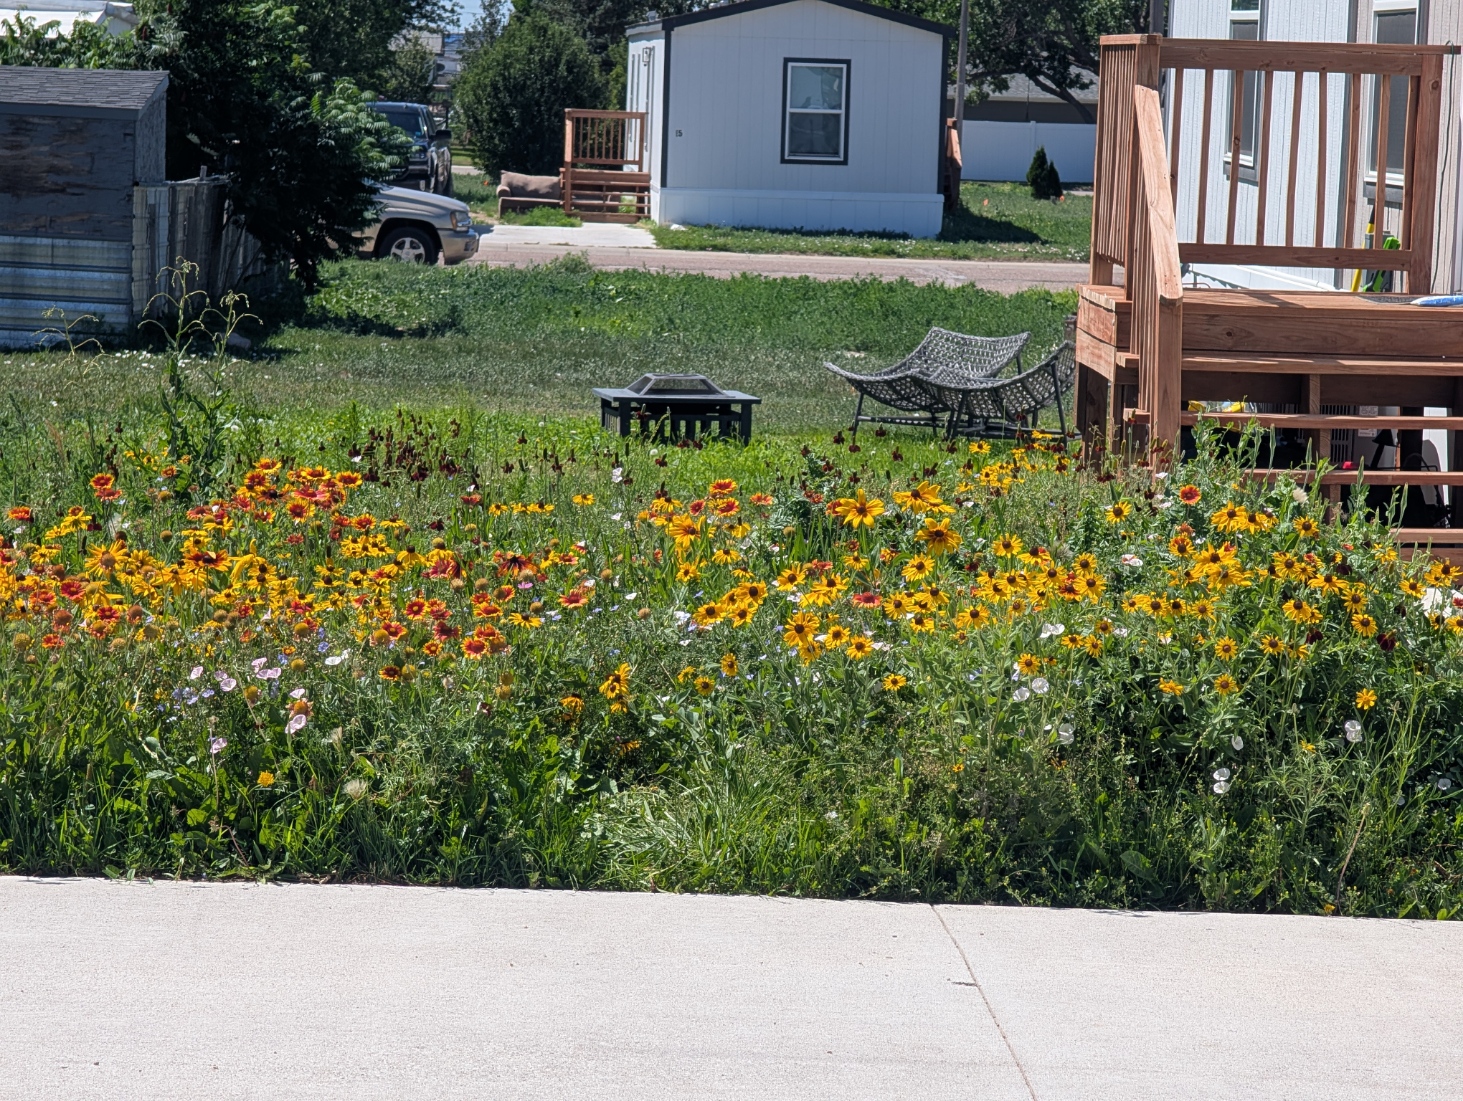
.jpg) BEFORE
BEFORE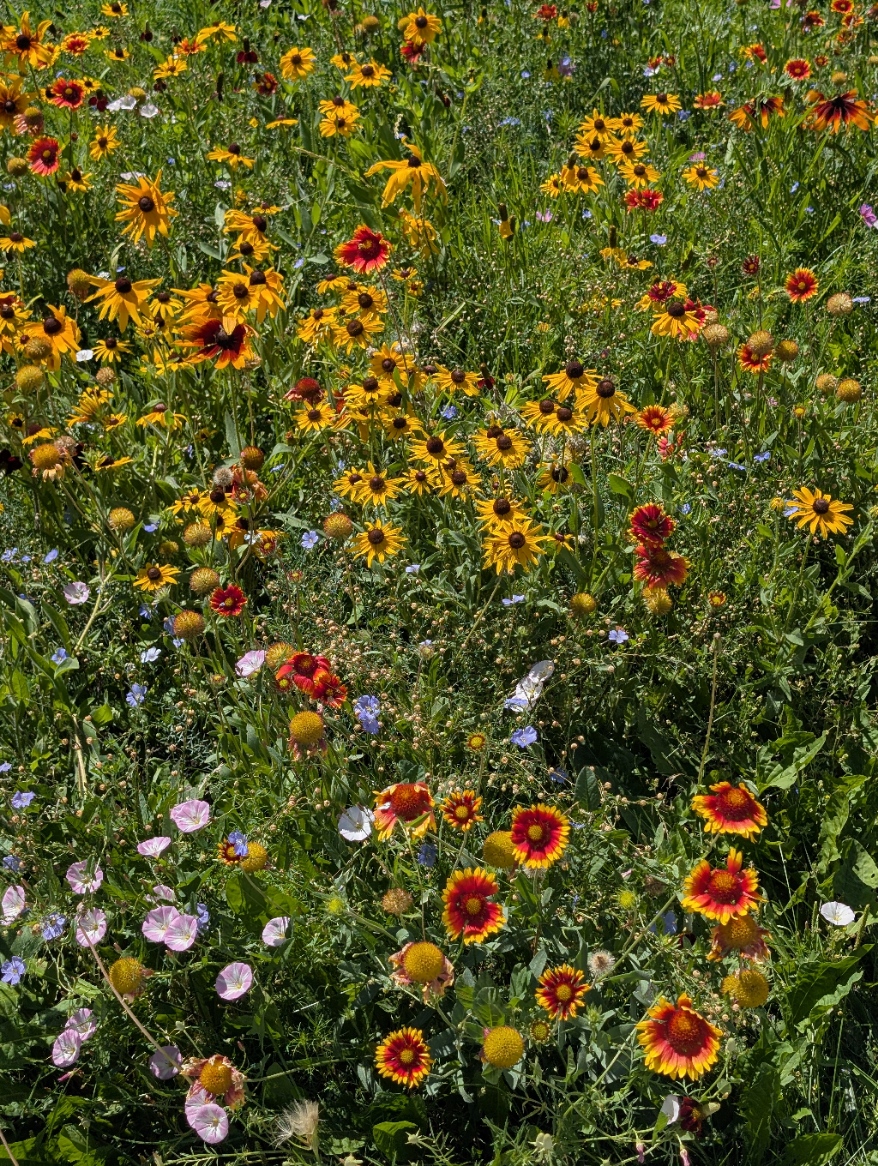 AFTER
AFTERThis Alliance-area example now includes the full visual story you sent: the bare-ground “before,” dense flower growth, a monarch, a bumblebee, and the 28.95-second garden video.
Replace maintenance with habitat. V2 keeps this story inside the subscriber experience instead of sending the viewer elsewhere.
Your Yard, By the Numbers
The household case is bigger than the water bill. A long-term water-wise landscape study found homes with mostly xeric landscaping averaged about 2.2 fewer hours of yard maintenance per month and $206 less per year in direct landscape-maintenance spending than homes with mostly turf. These were study-period results from Southern Nevada, not a promise of Alliance savings.
Protect the water beneath us. UNL reports that sustainable landscapes can reduce runoff and the movement of pollutants such as fertilizer and pesticides, while healthy roots and soil can help filter some pollutants and increase water infiltration.
Keep this in perspective: A single residential lawn is not the principal cause of Nebraska's groundwater contamination problems. The point is simpler: homeowners can reduce the water, fertilizer and pesticide inputs they personally control — and many households doing so can create a meaningful cumulative benefit.
Establishment matters: Newly planted native landscapes still require water, weed control and attention while becoming established. The larger water and maintenance advantages come after establishment.
Research & local data: University of Nebraska–Lincoln — Lawn Irrigation • University of Nebraska–Lincoln — Sustainable Landscapes • City of Alliance — Residential Water Rates • SNWA / U.S. Bureau of Reclamation — Xeriscape Conversion Study
Try Your Own Yard
Enter the approximate square feet of lawn you might replace with native flowers, grasses or other water-wise landscaping.
Replacing 1,000 sq. ft. of irrigated lawn could remove the need to apply this lawn-irrigation volume after the new landscape is established. Actual savings depend on rainfall, irrigation habits, plant choices and establishment needs.
Calculator basis: 1 inch of water over 1,000 sq. ft. ≈ 623 gallons. Alliance residential water rates used above are the local rates cited in this section. This is an estimate of lawn-irrigation volume and cost — not a guaranteed bill reduction.
Your Aquifer Area
Distance is not impact. The map shows where things are; it does not by itself prove hydrologic effect.
Open Existing Interactive Map