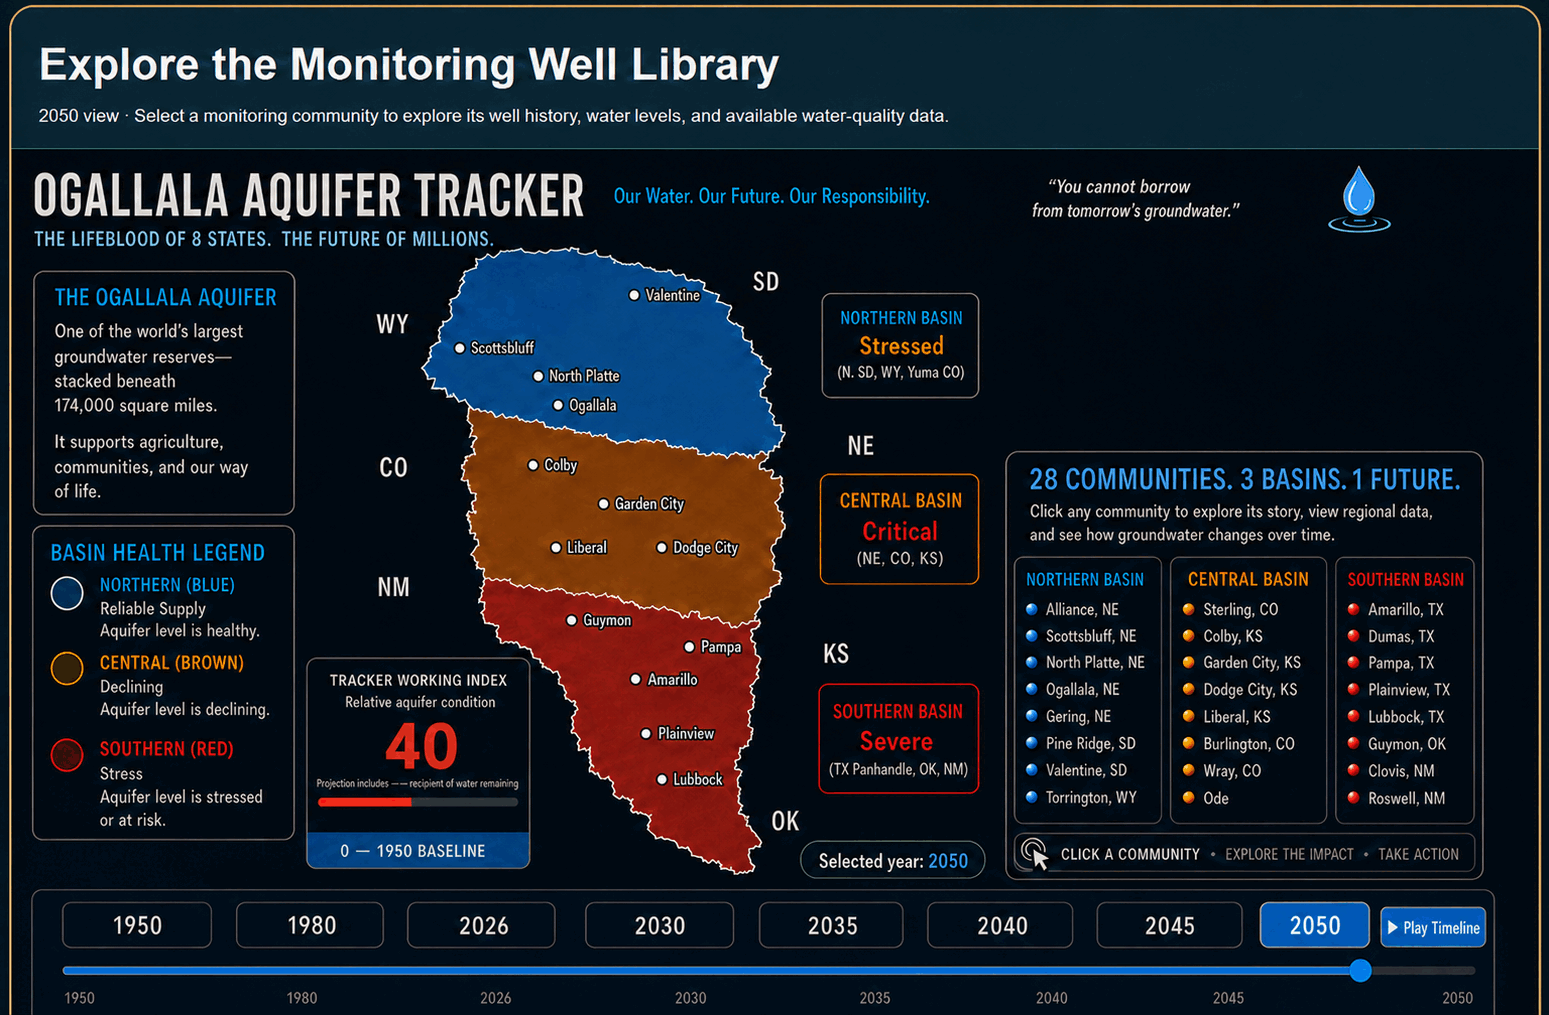
Monitoring Well Library: 28 completed community profiles across three basins, each with sourced groundwater-level history and available municipal water-quality comparisons.
Monitoring Well Profile Library
This section will hold one sourced profile for each of the 28 monitoring communities, including the longest reliable groundwater-level history available and the closest available water-quality records.
Alliance Recorder Well · Northern Unit
Northern Unit · Profile 1 of 28
Alliance Recorder Well
Box Butte County, Nebraska · High Plains Aquifer · UNL Conservation and Survey Division
Alliance water-table decline
Well depth: 259 feet · Measured quantity: depth to water below land surface. A larger value means the water table is farther underground.
Forty-year result: the selected spring measurement increased from 156.05 feet below land surface in 1985 to 213.44 feet in 2025—a documented 57.39-foot increase in depth to water. Larger depth means the water table is farther underground.
Monitoring well 26N 49W 6CC: 259-foot physical depth · High Plains aquifer · annual spring point selected from approved static measurements nearest March 20 · missing years remain gaps rather than being estimated.
Government water-quality data · City of Alliance · 2025
Nearby community drinking-water results. These values are not samples from the Alliance Recorder Well.
Nitrate–nitrite5.23 ppmEPA MCL: 10 ppm · 52.3% of limitBelow federal MCL
Arsenic5.47 ppbEPA MCL: 10 ppb · 54.7% of limitBelow federal MCL
Selenium4.27 ppbEPA MCL: 50 ppb · 8.5% of limitBelow federal MCL
Federal drinking-water guidelines
EPA Maximum Contaminant Levels are enforceable limits for public water systems. Alliance’s reported municipal results are compared directly with those federal limits below.
Contaminant
Alliance result
Federal EPA limit
Comparison
Nitrate–nitrite
5.23 ppm
10 ppm
Below limit
Arsenic
5.47 ppb
10 ppb
Below limit
Selenium
4.27 ppb
50 ppb
Below limit
Federal comparison: an EPA Maximum Contaminant Level (MCL) is the enforceable highest concentration allowed in public drinking water. These comparisons use the same units reported by the City.
Merrick County, Nebraska · High Plains Aquifer · USGS / Central Platte Natural Resources District
Grand Island water-table history
Well depth: 30 feet · Measured quantity: depth to water below land surface. A larger value means the water table is farther underground.
Complete available record: the selected annual measurement changed from 8.19 feet below land surface in 1999 to 7.85 feet in 2026—0.34 feet shallower overall. The record fluctuates seasonally but does not show the long-term systemic decline documented at Alliance.
Monitoring well 11N 8W31CCCA1: 30-foot physical depth · High Plains aquifer · constructed in 1999 · annual approved static measurement selected nearest March 20 when available. Because this well began in 1999, a 40-year graph cannot be supported; no earlier values are estimated.
Government water-quality data · City of Grand Island · 2025
Nearby community drinking-water results. These values are not samples from the Grand Island monitoring well.
Nitrate2.81 ppmEPA MCL: 10 ppm · 28.1% of limitBelow federal MCL
Arsenic3.6 ppbEPA MCL: 10 ppb · 36% of limit · sampled 2023Below federal MCL
Uranium28.4 ppbEPA MCL: 30 ppb · 94.7% of limitSee official violation notice below
Federal drinking-water guidelines
EPA Maximum Contaminant Levels are enforceable limits for public water systems. Grand Island’s municipal results are compared directly with those federal limits below.
Contaminant
Grand Island result
Federal EPA limit
Comparison
Nitrate
2.81 ppm
10 ppm
Below limit
Arsenic
3.6 ppb
10 ppb
Below limit
Uranium
28.4 ppb
30 ppb
Violation notice—see below
Grand Island’s 2025 uranium notice: the City reported a 32-ppb running annual average at Reed Well during the third quarter, above the 30-ppb MCL. The City states that no customers received water above the MCL and that Reed Well was taken out of service indefinitely. The table’s 28.4-ppb amount detected is the value reported in the regulated-substances table.
Lincoln County, Nebraska · High Plains Aquifer / Ogallala Formation · U.S. Geological Survey
North Platte water-table history
Well depth: 760 feet · Measured quantity: depth to water below land surface. A larger value means the water table is farther underground.
Long-term result: the selected spring measurement increased from 237.21 feet below land surface in 1978 to 245.05 feet in 2021—a documented 7.84-foot increase in depth to water. The line shows spring conditions to reduce seasonal pumping distortion.
Monitoring well 12N 29W31CCB 1 North Platte: 760-foot physical depth · High Plains aquifer / Ogallala Formation · constructed in 1978 · approved static measurement nearest March 20 selected for each year when available. Missing years remain gaps rather than being estimated; the published USGS record ends in 2021.
Government water-quality data · City of North Platte · 2025
Nearby community drinking-water results. These values are not samples from the North Platte monitoring well.
Nitrate–nitrite6.37 ppmEPA MCL: 10 ppm · 63.7% of limitBelow federal MCL
Arsenic5.97 ppbEPA MCL: 10 ppb · 59.7% of limitBelow federal MCL
Uranium24.9 ppbEPA MCL: 30 ppb · 83% of limit · sampled 2023Below federal MCL
Federal drinking-water guidelines
EPA Maximum Contaminant Levels are enforceable limits for public water systems. North Platte’s reported municipal results are compared directly with those federal limits below.
Contaminant
North Platte result
Federal EPA limit
Comparison
Nitrate–nitrite
6.37 ppm
10 ppm
Below limit
Arsenic
5.97 ppb
10 ppb
Below limit
Uranium
24.9 ppb
30 ppb
Below limit
Official 2025 finding: the City reported that no drinking-water violations occurred during calendar year 2025. Three November coliform samples triggered a required Level 1 assessment; the City completed the assessment and reported that no corrective actions were required.
TPNRD monitoring well G-038963: CSD ID 410538101355701 · legal location 13N 37W 18DDB · approximately 6.6 miles from Ogallala. The 278-foot well has 46 verified spring readings from 1977 through 2023. The chart leaves 2015 unconnected because the database contains a fall measurement but no comparable spring measurement for that year.
Government water-quality data · City of Ogallala
Nearby municipal drinking-water results. These values are not samples from TPNRD monitoring well G-038963. The values below are the latest fully extractable official City table retained for direct verification; the City also publishes a newer 2025 report at the link below.
Nitrate–nitrite2.97 ppmHighest reported value · EPA MCL: 10 ppm · 29.7% of limit · sampled 2021Below federal MCL
Arsenic4.27 ppbHighest reported value · EPA MCL: 10 ppb · 42.7% of limit · sampled 2020Below federal MCL
Selenium4.98 ppbHighest reported value · EPA MCL: 50 ppb · 10% of limit · sampled 2021Below federal MCL
Federal drinking-water guidelines
EPA Maximum Contaminant Levels are enforceable limits for public water systems. Ogallala's official reported results are compared directly with those limits.
Contaminant
Ogallala result
Federal EPA limit
Comparison
Nitrate–nitrite
2.97 ppm
10 ppm
Below limit
Arsenic
4.27 ppb
10 ppb
Below limit
Selenium
4.98 ppb
50 ppb
Below limit
Municipal supply context: the City reports eight municipal wells ranging from 203 to 403 feet deep. Its official 2021 report states that no drinking-water violations occurred during that calendar year.
USGS monitoring well 415048103370402: approximately 3 miles southeast of central Scottsbluff. The 30-foot well monitors unconfined sand and gravel deposits within the High Plains aquifer. The chart uses approved spring depth-to-water measurements and leaves 2016 and 2021–2023 as visible gaps because no comparable spring readings were published for those years. Retrieved August 24, 2026.
Government water-quality data · City of Scottsbluff
Nearby municipal drinking-water information. These values are not samples from USGS monitoring well 415048103370402; they are the City's published system-wide chemical analysis.
Nitrate6.2 ppmCity published concentration · EPA MCL: 10 ppm · 62% of limitBelow federal MCL
Fluoride0.60 ppmCity published concentration · EPA MCL: 4 ppm · 15% of limitBelow federal MCL
Sulfate243 ppmCity published concentration · EPA secondary standard: 250 ppm · 97.2% of guidelineBelow secondary guideline
Federal drinking-water comparisons
EPA Maximum Contaminant Levels are enforceable health standards. The sulfate comparison uses EPA's non-enforceable secondary standard for taste, odor, color, and other aesthetic effects.
Contaminant
Scottsbluff result
Federal benchmark
Comparison
Nitrate
6.2 ppm
10 ppm MCL
Below limit
Fluoride
0.60 ppm
4 ppm MCL
Below limit
Sulfate
243 ppm
250 ppm secondary standard
Below guideline
Municipal supply context: the City reports that its system is supplied by 12 groundwater wells drilled to an average depth of 100 feet, with average demand of 3.8 million gallons per day.
Oglala Lakota County, South Dakota · High Plains Aquifer / Arikaree Formation · Oglala Sioux Tribe
Verified 1989–2025 annual groundwater-level record
Well depth: 180 feet · Record: 37 approved, non-estimated annual measurements. A larger depth-to-water value means the water table is farther underground.
USGS monitoring well 430027102311801: approximately 2 miles southeast of Pine Ridge. The 180-foot OST Shallow North well monitors the unconfined Arikaree Formation within the High Plains aquifer. One approved, non-estimated static measurement per year is shown, selected nearest April 1 when available. The first 1987–1988 readings were excluded because USGS identifies their method as estimated/report-observed; no replacement values were invented. Retrieved August 24, 2026.
Government water-quality data · Pine Ridge Water System
Tribal community drinking-water information for EPA public water system 084690475. These values are not samples from the OST Shallow North monitoring well.
Lead · 20210.001 mg/LEPA-reported 90th percentile · 6.7% of 0.015 mg/L action levelBelow action level
EPA compliance context
Lead and copper use federal action levels rather than Maximum Contaminant Levels. EPA ECHO identifies Pine Ridge as an active tribal-government community water system supplied by groundwater, serving 7,482 people. Its current EPA search flags show no active health-based, monitoring/reporting, public-notice, or other violation.
Reporting year
Lead 90th percentile
EPA action level
Comparison
2023
0 mg/L
0.015 mg/L
Below action level
2022
0 mg/L
0.015 mg/L
Below action level
2021
0.001 mg/L
0.015 mg/L
Below action level
Important distinction: Pine Ridge is a tribal public water system overseen through EPA Region 8. State or municipal reports for similarly named communities elsewhere are not used here.
USGS monitoring well 430715101444701: approximately 4 miles south of Martin. The 345-foot BT-76E well monitors the unconfined Arikaree Formation within the High Plains aquifer. One approved reported observation per year is shown, selected nearest April 1 when available. USGS labels this historical series “estimated, reported, or observed”; the tracker preserves that official method description and does not interpolate or manufacture values. Newer 2023–2025 electric-tape readings remain provisional and are not used. Retrieved August 24, 2026.
Government water-quality data · City of Martin
Municipal drinking-water results from South Dakota's official 2024 report. These values are not samples from monitoring well BT-76E.
Arsenic10.00 ppbHighest detected · EPA MCL: 10 ppb · 100% of limit · tested August 6, 2024At federal MCL
Nitrate as nitrogen0.9 ppmHighest detected · EPA MCL: 10 ppm · 9% of limit · tested August 28, 2024Below federal MCL
Fluoride0.78 ppmHighest detected · EPA MCL: 4 ppm · 19.5% of limit · tested June 12, 2024Below federal MCL
Federal drinking-water comparisons
Martin's official report states that the system meets EPA standards and specifically notes that arsenic is present at a low level. The reported arsenic result equals the federal Maximum Contaminant Level, so it is shown here at 100% rather than described as below the limit.
Contaminant
Martin result
Federal benchmark
Comparison
Arsenic
10.00 ppb
10 ppb MCL
At limit
Nitrate as nitrogen
0.9 ppm
10 ppm MCL
Below limit
Fluoride
0.78 ppm
4 ppm MCL
Below limit
Municipal supply context: the City reports serving more than 985 customers with an average of 238,000 gallons per day from local groundwater wells. South Dakota rated the source-water susceptibility as medium, and Martin received the Secretary's Award after fourteen consecutive years of safe drinking water.
Goshen County, Wyoming · High Plains Aquifer / Arikaree Formation
Verified 1996–2026 groundwater-level record
Well depth: 180 feet · Record: 30 official annual readings. Published and provisional values are distinguished below; a larger depth-to-water value means the water table is farther underground.
Wyoming SEO Sandstone No. 1 · location 28-62-18cba: approximately 25 miles north-northwest of Torrington. The 180-foot well is completed in the Arikaree Formation; the matching USGS site 422347104212001 classifies it in the national High Plains aquifer. For 1996–2012, the graph uses the state’s recorded reading at April 1; 2003 remains blank because no reading was available. For 2013–2026, it uses one state field measurement per year, nearest April 1. Gold marks published readings and aqua marks provisional readings exactly as labeled by Wyoming. No missing year is estimated or interpolated. Retrieved August 24, 2026.
Government water-quality data · City of Torrington
Municipal drinking-water results from the City's official 2024 Annual Water Quality Report (PWS WY5600164). These values are not samples from Sandstone No. 1.
Nitrate as nitrogen8.6 ppmHighest detected · EPA MCL: 10 ppm · 86% of limit · sampled 2024Below federal MCL
Uranium27.4 µg/LDetected · EPA MCL: 30 µg/L · 91.3% of limit · sampled 2022Below federal MCL
Fluoride0.3 ppmDetected · EPA MCL: 4 ppm · 7.5% of limit · sampled 2024Below federal MCL
Federal drinking-water comparisons
The City reported no violation for these contaminants. Nitrate and uranium were below their federal maximum contaminant levels, but each was above 85% of its respective limit in the report; the comparison bars show that relationship directly.
Contaminant
Torrington result
Federal benchmark
Comparison
Nitrate as nitrogen
8.6 ppm
10 ppm MCL
Below limit
Uranium
27.4 µg/L
30 µg/L MCL
Below limit
Fluoride
0.3 ppm
4 ppm MCL
Below limit
Municipal supply context: Torrington reports that its drinking water comes from groundwater wells and is treated by filtration and disinfection. The report also states that the City's service-line inventory contains no lead service lines.
Laramie County, Wyoming · High Plains Aquifer / Brule Formation
Verified 1987–2026 groundwater-level record
Well depth: 98 feet · Record: 40 official annual readings. Published and provisional values are distinguished below; a larger depth-to-water value means the water table is farther underground.
Wyoming SEO CC Gross · location 14-60-05bcb: approximately 4 miles northwest of Pine Bluffs. The 98-foot well is completed in the Brule Formation, and USGS classifies matching site 411238104070801 in the national High Plains aquifer. The graph uses the Wyoming recorded reading nearest April 1 for each year. Five gaps in the recorded series are filled only with documented measurements from the same well: USGS approved static readings for 2003, 2004, and 2010, and Wyoming published field visits for 2017 and 2019. Gold marks published or USGS-approved readings; aqua marks Wyoming provisional readings. No value is invented or interpolated. Point-in-time depths can reflect seasonal pumping, including the sharp 2004 and 2012 readings. Retrieved August 24, 2026.
Government water-quality data · Town of Pine Bluffs
Municipal drinking-water results from the Town’s official 2023 Annual Drinking Water Quality Report. These values are not samples from the CC Gross monitoring well.
Nitrate as nitrogen6.2 ppmHighest detected · EPA MCL: 10 ppm · 62% of limitBelow federal MCL
Uranium12 µg/LHighest detected · EPA MCL: 30 µg/L · 40% of limitBelow federal MCL
Arsenic3 ppbHighest detected · EPA MCL: 10 ppb · 30% of limitBelow federal MCL
Federal drinking-water comparisons
The Town reported no MCL violation for nitrate, uranium, or arsenic. Its report also documents earlier lead-related monitoring, treatment, notification, and public-education requirements under an EPA administrative order and states that the listed deficiencies returned to compliance during 2023.
Contaminant
Pine Bluffs result
Federal benchmark
Comparison
Nitrate as nitrogen
6.2 ppm
10 ppm MCL
Below limit
Uranium
12 µg/L
30 µg/L MCL
Below limit
Arsenic
3 ppb
10 ppb MCL
Below limit
Municipal supply context: Pine Bluffs reports that its wells draw from the High Plains aquifer’s Brule and terrace formations and from the Lance/Fox Hills aquifer. The water is chlorinated before entering storage tanks.
Yuma County, Colorado · High Plains Aquifer / Ogallala Formation
Verified 1986–2025 groundwater-level window
Well depth: 248 feet · Record: 38 official static observations in the 40-year window. A larger depth-to-water value means the water table is farther underground.
Colorado DWR NHP-CY-009 · site 576: approximately 14 miles east-southeast of Yuma at 40.050553, −102.487158. The 248-foot well is unconfined and completed in the Ogallala Formation; NGWMN classifies it in the national High Plains aquifer. The graph preserves every official manual measurement in the 1986–2025 window. No readings are published for 1986, 1997, or 2002, so those years remain visible gaps and no value is invented or interpolated. Retrieved August 24, 2026.
Government water-quality data · City of Yuma
Municipal drinking-water results from Colorado’s official 2026 report covering calendar year 2025. These values are not samples from monitoring well NHP-CY-009.
Arsenic8.83 ppb2025 average; range 8–9 ppb · EPA MCL: 10 ppb · 88.3% of limitBelow federal MCL; no violation
Nitrate as nitrogen3.32 ppm2025 average; range 2.1–4.3 ppm · EPA MCL: 10 ppm · 33.2% of limitBelow federal MCL; no violation
Combined uranium7 ppb2025 average; range 6.7–7.2 ppb · EPA MCL: 30 ppb · 23.3% of limitBelow federal MCL; no violation
Federal drinking-water comparisons
The official report lists no MCL violation for arsenic, nitrate, or uranium. It specifically notes that Yuma’s water meets the arsenic standard while containing low levels of naturally occurring arsenic.
Contaminant
Yuma 2025 average
Federal benchmark
Comparison
Arsenic
8.83 ppb
10 ppb MCL
Below limit
Nitrate as nitrogen
3.32 ppm
10 ppm MCL
Below limit
Combined uranium
7 ppb
30 ppb MCL
Below limit
Municipal supply context: The City report identifies seven groundwater wells—Koenig, Hamrick, Hansen Park, Mitchell, West Grade School, Fairgrounds, and Shop—as Yuma’s drinking-water sources.
Finney County, Kansas · High Plains Aquifer / Ogallala Formation
Verified 2001–2026 groundwater-level record
Well depth: 354 feet (original) / 380 feet (replacement) · Record: 24 official annual observations. A larger depth-to-water value means the water table is farther underground.
Kansas DWR/KGS location 23S 34W 32BCC: approximately 12 miles northwest of Garden City at 38.0111, −101.0845. Kansas monitored the original 354-foot well through 2015 and installed the 380-foot replacement at the same location in 2017; the replacement is screened from 340 to 360 feet in the unconfined Ogallala Formation. The graph uses the first valid official measurement in each calendar year, favoring the winter recovery reading when available. No reading is published for 2003 or during the 2016 well transition, so those years remain visible gaps. No value is invented or interpolated. Retrieved August 24, 2026.
Government water-quality data · City of Garden City
Municipal drinking-water results from the City’s official 2026 Consumer Confidence Report. These values are not samples from the 23S 34W 32BCC monitoring wells.
Combined uranium29 µg/LHighest reported, collected May 6, 2024 · EPA MCL: 30 µg/L · 96.7% of limitBelow federal MCL; standard met
Nitrate as nitrogen4 ppmHighest 2025 value; range 0–4 ppm · EPA MCL: 10 ppm · 40% of limitBelow federal MCL; standard met
Arsenic1.8 ppbHighest 2025 value; range 0–1.8 ppb · EPA MCL: 10 ppb · 18% of limitBelow federal MCL; standard met
Federal drinking-water comparisons
The City report marks the federal standard as met for uranium, nitrate, and arsenic. Uranium is the closest of these results to its MCL, at 29 of 30 µg/L; “below the limit” does not mean zero.
Contaminant
Garden City result
Federal benchmark
Comparison
Combined uranium
29 µg/L
30 µg/L MCL
Below limit
Nitrate as nitrogen
4 ppm
10 ppm MCL
Below limit
Arsenic
1.8 ppb
10 ppb MCL
Below limit
Municipal supply context: The City uses groundwater wells and also receives a portion of its supply through a consecutive connection with Wheatland Electric Cooperative. The City water page identifies the Ogallala as the source for most municipal wells, with three wells drawing from the Dakota Sandstone aquifer.
Thomas County, Kansas · High Plains Aquifer / Ogallala Formation
Verified 1987–2026 groundwater-level record
Well depth: 175 feet · Record: 40 official January observations with no missing years. A larger depth-to-water value means the water table is farther underground.
KGS/KSU Colby observation well · USGS ID 392329101040201: at the K-State experiment station on the west side of Colby, 39.392195, −101.067825. The 175-foot observation well is screened from 156 to 175 feet in the unconfined High Plains/Ogallala aquifer. The graph uses the first official January steel-tape reading in each year from 1987 through 2026. KGS added continuous telemetry in 2015, but the earlier monthly steel-tape archive makes the complete 40-year annual window possible. No value is estimated or interpolated. Retrieved August 24, 2026.
Government water-quality data · City of Colby
Municipal drinking-water results from the City’s official 2026 Consumer Confidence Report covering calendar year 2025. These values are not samples from the KSU experiment-station monitoring well.
Nitrate as nitrogen8.8 ppmHighest value, collected February 10, 2025; range 1.4–8.8 ppm · EPA MCL: 10 ppm · 88% of limitBelow federal MCL
Combined uranium13 µg/LReported January 3, 2022 · EPA MCL: 30 µg/L · 43.3% of limitBelow federal MCL
Arsenic4.1 ppbHighest reported value; range 2.1–4.1 ppb · EPA MCL: 10 ppb · 41% of limitBelow federal MCL
Federal drinking-water comparisons
The report lists no additional health-effects violation notice. Nitrate is the closest of these three results to its federal limit, at 8.8 of 10 ppm; the City includes EPA’s required infant-health advisory for nitrate levels above the MCL.
Contaminant
Colby result
Federal benchmark
Comparison
Nitrate as nitrogen
8.8 ppm
10 ppm MCL
Below limit
Combined uranium
13 µg/L
30 µg/L MCL
Below limit
Arsenic
4.1 ppb
10 ppb MCL
Below limit
Municipal supply context: Colby reports nine groundwater sources: Test Well 0501 and municipal Wells 06, 07, 09, 11, 12, 13, 14, and 15.
Ford County, Kansas · High Plains Aquifer / Ogallala Formation
Verified 1987–2026 groundwater-level record
Well depth: 97.7 feet · Record: 40 official annual observations with no missing years. A larger depth-to-water value means the water table is farther underground.
Kansas DWR/KGS observation well 27S 24W 03BBD 01 · USGS ID 374337099561401: approximately 5 miles east-southeast of Dodge City at 37.73289, −99.94031. The unused 97.7-foot observation well is recorded in the Ogallala/High Plains system. The graph uses the first official measurement available in each calendar year. Thirty-eight points are winter recovery readings; 1991 and 1996 have only October and July readings, respectively, and are marked separately because seasonal pumping can make them less comparable. No year or value is invented or interpolated. Retrieved August 24, 2026.
Government water-quality data · City of Dodge City
Municipal drinking-water results from the City’s official 2025 Consumer Confidence Report. These values are not samples from monitoring well 27S 24W 03BBD 01.
Nitrate as nitrogen9.8 ppmHighest 2025 value; range 0.92–9.8 ppm · EPA MCL: 10 ppm · 98% of limitBelow federal MCL
Fluoride2.7 ppmHighest 2025 value · EPA MCL: 4 ppm · 67.5% of health-based limit; above 2 ppm secondary standardBelow MCL; public notice issued
Arsenic3.6 ppbHighest 2025 value; range 1.1–3.6 ppb · EPA MCL: 10 ppb · 36% of limitBelow federal MCL
Federal drinking-water comparisons
Dodge City states that its water met or surpassed all state and federal health standards in 2025. Nitrate was close to its MCL at 9.8 of 10 ppm. The City also issued required notice because naturally occurring fluoride from Well 20 averaged above the 2 ppm non-health secondary standard, though it remained below the 4 ppm health-based MCL.
Contaminant
Dodge City result
Federal benchmark
Comparison
Nitrate as nitrogen
9.8 ppm
10 ppm MCL
Below limit
Fluoride
2.7 ppm
4 ppm MCL; 2 ppm SMCL
Below MCL; above SMCL
Arsenic
3.6 ppb
10 ppb MCL
Below limit
Municipal supply context: Dodge City reports that its water comes from the Ogallala Aquifer. The City uses 14 wells plus seven wells operated with National Beef; two additional wells were voluntarily removed from service because of nitrate detections.
Sherman County, Kansas · High Plains Aquifer / Ogallala Formation
Verified 1987–2026 groundwater-level record
Well depth: 247 feet · Record: 40 official annual observations with no missing years. A larger depth-to-water value means the water table is farther underground.
Kansas observation well 08S 40W 12DBA 01 · USGS ID 392218101435301: approximately 2 miles north-northwest of Goodland at 39.372779, −101.732451. The unused 247-foot observation well is recorded in the Ogallala/High Plains system. The graph uses the January or February winter recovery measurement in each calendar year when available. The sole exception is 2007, when April 3 is the only official observation; that point is marked separately because seasonal timing can affect comparability. Every year is observed—no value is invented or interpolated. Retrieved August 24, 2026.
Government water-quality data · City of Goodland
Municipal drinking-water results from the City’s official 2026 Consumer Confidence Report, covering water supplied in 2025 and the latest required sampling dates. These values are not samples from monitoring well 08S 40W 12DBA 01.
Nitrate as nitrogen8.7 ppmMarch 18, 2025 · EPA MCL: 10 ppm · 87% of limitBelow federal MCL
Arsenic2.3 ppbFebruary 12, 2024 · EPA MCL: 10 ppb · 23% of limitBelow federal MCL
Gross alpha7 pCi/LMay 6, 2025 · EPA MCL: 15 pCi/L · 46.7% of limitBelow federal MCL
Federal drinking-water comparisons
Goodland’s reported nitrate, arsenic, and gross-alpha results were below their federal maximum contaminant levels. Nitrate was the closest of these three comparisons at 8.7 ppm against the 10 ppm MCL.
Contaminant
Goodland result
Federal benchmark
Comparison
Nitrate as nitrogen
8.7 ppm
10 ppm MCL
Below limit
Arsenic
2.3 ppb
10 ppb MCL
Below limit
Gross alpha
7 pCi/L
15 pCi/L MCL
Below limit
Municipal supply context: Goodland reports authority over 11 groundwater wells. Its municipal wells average about 290–300 feet deep, except Wells 9 and 11 at about 350 feet, and all draw from the Ogallala Aquifer.
Seward County, Kansas · High Plains Aquifer / Ogallala Formation
Verified 1987–2026 groundwater-level record
Well depth: 383 feet · Record: 40 official annual winter observations with no missing years. A larger depth-to-water value means the water table is farther underground.
Kansas observation well 35S 33W 16BCA 01 · USGS ID 370023100550801: approximately 2.5 miles south of central Liberal at 37.005856, −100.917644. KGS records the 383-foot irrigation well in Quaternary and Tertiary Ogallala units. The graph uses the January or February winter recovery reading in each calendar year. In 2008, 2012, 2018, 2019, and 2023, two technicians recorded the well on the same date; the plotted annual point is the mean of those two official readings. Every year is observed—no value is invented or interpolated. Retrieved August 24, 2026.
Government water-quality data · City of Liberal
Municipal drinking-water results from the City’s official Annual Water Quality Report covering testing through 2024 and the latest required sampling years. These values are not samples from monitoring well 35S 33W 16BCA 01.
Gross alpha activity9.3 pCi/L2021 sample · EPA MCL: 15 pCi/L · 62% of limitBelow federal MCL
Nitrate as nitrogen3.9 ppmHighest 2024 value; range 2–3.9 ppm · EPA MCL: 10 ppm · 39% of limitBelow federal MCL
Combined uranium11 ppbHighest 2021 value; range non-detect–11 ppb · EPA MCL: 30 ppb · 36.7% of limitBelow federal MCL
Federal drinking-water comparisons
Liberal reported no violation for these three detected substances. Gross alpha was the closest comparison at 9.3 pCi/L against the 15 pCi/L federal MCL.
Contaminant
Liberal result
Federal benchmark
Comparison
Gross alpha activity
9.3 pCi/L
15 pCi/L MCL
Below limit
Nitrate as nitrogen
3.9 ppm
10 ppm MCL
Below limit
Combined uranium
11 ppb
30 ppb MCL
Below limit
Municipal supply context: Liberal reports that its primary drinking-water source is the Ogallala, or High Plains, Aquifer. Seventeen municipal wells provide nearly 2.5 million gallons per day, and the water is chlorinated before entering storage and distribution.
Kit Carson County, Colorado · High Plains Aquifer / Ogallala Formation
Verified 1987–2026 groundwater-level record
Well depth: 337 feet · Record: 35 official measurements across the 40-year window. Missing calendar years remain visible gaps. A larger depth-to-water value means the water table is farther underground.
Colorado DWR surveillance well NHP-PL-101 · site 875: approximately 5 miles southwest of Burlington at 39.243617, −102.212692. The 337-foot well is screened from 177 to 337 feet in the unconfined Ogallala/High Plains aquifer. The graph uses the first official observation in each calendar year. March and April readings are marked separately from January–February winter readings. No approved measurements are listed for 1995, 2003, 2006, 2017, or 2023; the graph breaks at every missing year and does not interpolate. Retrieved August 24, 2026.
Government water-quality data · City of Burlington
Municipal drinking-water results from Burlington’s official 2026 Drinking Water Quality Report, covering 2025 and the latest required sampling years. These values are not samples from monitoring well NHP-PL-101.
Nitrate as nitrogen9.6 ppmHighest 2025 result; average 6.69 ppm, range 5–9.6 ppm · EPA MCL: 10 ppm · 96% of limitBelow federal MCL
Arsenic5 ppb2024 result · EPA MCL: 10 ppb · 50% of limitBelow federal MCL
Combined uranium11 ppb2023 result · EPA MCL: 30 ppb · 36.7% of limitBelow federal MCL
Federal drinking-water comparisons
The City reported no MCL violation for these three detected substances. The highest 2025 nitrate result was close to the federal limit at 9.6 of 10 ppm.
Contaminant
Burlington result
Federal benchmark
Comparison
Nitrate as nitrogen
9.6 ppm maximum
10 ppm MCL
Below limit
Arsenic
5 ppb
10 ppb MCL
Below limit
Combined uranium
11 ppb
30 ppb MCL
Below limit
Municipal supply context: Burlington’s report lists eight active groundwater wells in Kit Carson County. These municipal system results describe treated public drinking water and do not establish the chemistry of the separate DWR monitoring well.
Yuma County, Colorado · High Plains Aquifer / Ogallala Formation
Verified 1987–2026 groundwater-level record
Well depth: 268 feet · Record: 37 official measurements across the 40-year window. Missing calendar years remain visible gaps. A larger depth-to-water value means the water table is farther underground.
Colorado DWR surveillance well NHP-SH-008 DOKE · site 525 · USGS 401150102082500: approximately 9 miles northeast of Wray at 40.197500, −102.138812. The 268-foot well is perforated from 120 to 268 feet in the Ogallala aquifer. The graph uses the first official observation in each actual calendar year. March and April readings are marked separately from January–February winter readings. The state record contains late-December readings in 1996, 2001, and 2009; those observations are not relabeled as 1997, 2002, or 2010, so the graph breaks at those calendar-year gaps and does not interpolate. Retrieved August 24, 2026.
Government water-quality data · City of Wray
Municipal drinking-water results from Wray’s official 2025 Consumer Confidence Report, covering 2024 and the latest required sampling years. These values are not samples from monitoring well NHP-SH-008 DOKE.
Arsenic8 ppb2022 result · EPA MCL: 10 ppb · 80% of limitBelow federal MCL
Combined radium2 pCi/L2022 result · EPA MCL: 5 pCi/L · 40% of limitBelow federal MCL
Nitrate as nitrogen1.9 ppm2024 result · EPA MCL: 10 ppm · 19% of limitBelow federal MCL
Federal drinking-water comparisons
The City reported no MCL violation for these three detected substances. The report separately lists non-health-based monitoring, public-notice, and system deficiencies; those entries are not contaminant-limit exceedances for the results compared here.
Contaminant
Wray result
Federal benchmark
Comparison
Arsenic
8 ppb
10 ppb MCL
Below limit
Combined radium
2 pCi/L
5 pCi/L MCL
Below limit
Nitrate as nitrogen
1.9 ppm
10 ppm MCL
Below limit
Municipal supply context: Wray’s report identifies five active groundwater sources—Wells 6 through 10—for public water system CO0163010. These municipal system results describe public drinking water and do not establish the chemistry of the separate DWR monitoring well.
Quay County, New Mexico · High Plains Aquifer eastern-edge monitoring context
Verified 1988–2026 groundwater-level record
Well depth: 175 feet · Record: 38 USGS-approved static measurements in the 1987–2026 window. The unobserved years remain visible gaps. A larger depth-to-water value means the water table is farther underground.
USGS well 15N.35E.11.21222 436 · site 353239103111301: approximately 40 miles northeast of Tucumcari at 35.548583, −103.190222. USGS classifies this 175-foot alluvial well in the national High Plains Aquifer system (aquifer code 110AVMB; national code N100HGHPLN). It is not one of Tucumcari’s municipal Entrada Sandstone wells and is not labeled here as an Ogallala Formation completion. The graph uses the first approved static observation in each actual calendar year. March–September observations are marked separately from January–February winter readings. No approved observation appears for 1987 or 2005; no value is interpolated. Retrieved August 24, 2026.
Government water-quality data · Tucumcari Water System
Municipal drinking-water results from Tucumcari’s official 2025 Consumer Confidence Report. These values are not samples from USGS monitoring well 353239103111301.
Arsenic2 ppb2023 result · EPA MCL: 10 ppb · 20% of limitBelow federal MCL
Nitrate as nitrogen1.44 ppm2025 result; range 1.06–1.44 ppm · EPA MCL: 10 ppm · 14.4% of limitBelow federal MCL
Uranium19 µg/L2025 result; reported range 19–21 µg/L · EPA MCL: 30 µg/L · 63.3% of limitBelow federal MCL
Federal drinking-water comparisons
The City’s report marks no violation for these three detected substances. A reported range may include individual-source results; the “detected in your water” value is used for the comparison.
Contaminant
Tucumcari result
Federal benchmark
Comparison
Arsenic
2 ppb
10 ppb MCL
Below limit
Nitrate as nitrogen
1.44 ppm
10 ppm MCL
Below limit
Uranium
19 µg/L
30 µg/L MCL
Below limit
Municipal supply context: The City describes ten municipal wells, 300–400 feet deep, completed in the Entrada Sandstone Formation and alluvial aquifer. Municipal water is disinfected. This supply system is hydrogeologically separate from the High Plains monitoring well graphed above.
Randall County, Texas · High Plains Aquifer / Ogallala–Dockum completion
Verified 1988–2025 groundwater-level record
Well depth: 390 feet · Record: 29 publishable static measurements in the 1987–2026 window. Failed and missing observations remain visible gaps. A larger depth-to-water value means the water table is farther underground.
TWDB well UY-06-50-901 · state well 0650901 · USGS 350827101453401: approximately 6 miles southeast of central Amarillo at 35.140833, −101.759444. TWDB lists the 390-foot well in the combined Ogallala/Dockum interval (aquifer code 121OGDK); the federal record identifies the Ogallala and national High Plains aquifers. The graph includes only TWDB “Publishable” measurements and uses the first publishable observation in each actual calendar year. All plotted observations are November–January recovery measurements. The 1991 pumping-level reading is excluded as “Questionable,” and TWDB’s explicit failed visits remain gaps: pumping in 1990, inaccessible tape in 1999, road/access failure in 2015, COVID interruptions in 2020 and early 2022, and wet-casing trouble in 2023. Years with no listed visit also remain open. No 2026 value or artificial present-day trend is drawn. Retrieved August 24, 2026.
Government water-quality data · Amarillo Municipal Water System
Municipal drinking-water results from Amarillo’s official 2023 Consumer Confidence Report, the latest City report whose individual contaminant table was fully verifiable in machine-readable form during this review. The City also publishes a 2025 report and states that its system met state and federal standards in 2025. These values are not samples from monitoring well UY-06-50-901.
Arsenic2 ppbHighest 2023 level; range 1.7–2.1 ppb · EPA MCL: 10 ppb · 20% of limitBelow federal MCL
Nitrate as nitrogen1 ppmHighest 2023 level; range 0.965–1.37 ppm · EPA MCL: 10 ppm · 10% of limitBelow federal MCL
Uranium7 ppbHighest 2023 level; range 5.9–7 ppb · EPA MCL: 30 ppb · 23.3% of limitBelow federal MCL
Federal drinking-water comparisons
The 2023 report marks no MCL violation for these three detected substances. It separately records a Consumer Confidence Report delivery violation; that reporting failure is not a contaminant-limit exceedance.
Contaminant
Amarillo result
Federal benchmark
Comparison
Arsenic
2 ppb maximum
10 ppb MCL
Below limit
Nitrate as nitrogen
1 ppm maximum
10 ppm MCL
Below limit
Uranium
7 ppb maximum
30 ppb MCL
Below limit
Municipal supply context: Amarillo combines groundwater with surface water and treats the municipal supply at the Osage Water Treatment Plant. System-wide drinking-water results do not establish the chemistry of the separate TWDB monitoring well.
Official 2023–2026 automated groundwater-level record
Well depth: 365 feet · Official period of record: November 17, 2023–August 23, 2026. A larger depth-to-water value means the water table is farther underground.
TWDB state well 2312401: an active 365-foot, unconfined Ogallala Formation well at 33.795556, −101.612500 in Lubbock County, operated by the Texas Water Development Board with a satellite transducer. The graph reproduces six dated “Daily High Water Level” values shown in TWDB’s official summary: the oldest observation, one-year, six-month, three-month, one-month, and current milestones. TWDB labels these automated data provisional and subject to revision. The record begins in late 2023, so no artificial 40-year history or pre-2023 endpoints are drawn. Retrieved August 24, 2026.
Government water-quality data · Lubbock Public Water System
Municipal drinking-water results from the City of Lubbock’s official 2025 Consumer Confidence Report. These system-wide values are not samples from monitoring well 2312401.
Arsenic4.6 ppb2025 maximum; range 1.4–4.6 ppb · EPA MCL: 10 ppb · 46% of limitBelow federal MCL
Nitrate as nitrogen1.59 ppm2025 maximum · EPA MCL: 10 ppm · 15.9% of limitBelow federal MCL
Uranium5.1 ppb2023 maximum; minimum 2.9 ppb · EPA MCL: 30 ppb · 17% of limitBelow federal MCL
Federal drinking-water comparisons
The City report marks no MCL violation for arsenic, nitrate, or uranium. Its separate 2025 lead-service-line notification violation concerned a missed notice deadline; the City states water quality was not affected.
Contaminant
Lubbock result
Federal benchmark
Comparison
Arsenic
4.6 ppb maximum
10 ppb MCL
Below limit
Nitrate as nitrogen
1.59 ppm maximum
10 ppm MCL
Below limit
Uranium
5.1 ppb maximum
30 ppb MCL
Below limit
Municipal supply context: Lubbock reports that groundwater supplies 61% of system use from the Roberts County and Bailey County well fields, while Lake Alan Henry and Lake Meredith supply 39%. Municipal results do not establish the chemistry of the separate Lubbock County monitoring well.
Hale County, Texas · High Plains Aquifer / Ogallala Formation
Verified 1985–2025 groundwater-level window
Well depth: 271 feet · Record: 31 publishable measurements in the 1985–2025 window. The official record has no observations in 1985–1993 or 2023; those years remain gaps. A larger depth-to-water value means the water table is farther underground.
TWDB well KY-11-60-204 · state well 1160204 · USGS TX001-340533101344104: a 271-foot unconfined Ogallala surveillance well southeast of Plainview at 34.092500, −101.578055. TWDB’s full record extends from 1915 to 2025; this graph uses the requested forty-year window and includes only rows marked “P — Publishable.” All plotted visits are January–February recovery measurements except the first, measured May 16, 1994. The 1985–1993 interval and unobserved 2023 year remain open rather than interpolated. The 2025 depth-to-water value exceeds the listed 271-foot well depth; the NGWMN flags this site as having “Known Changes,” and the chart reports the agencies’ published values without silently correcting them. Retrieved August 24, 2026.
Government water-quality data · Plainview Municipal Water System
Municipal drinking-water results from Plainview’s official 2025 Consumer Confidence Report. These system-wide values are not samples from monitoring well KY-11-60-204.
Arsenic4 ppb2025 amount detected; range 3.2–4 ppb · EPA MCL: 10 ppb · 40% of limitBelow federal MCL
Nitrate2.02 ppm2025 amount detected; range 0.93–2.02 ppm · EPA MCL: 10 ppm · 20.2% of limitBelow federal MCL
Uranium8.6 ppb2023 amount detected; range ND–8.6 ppb · EPA MCL: 30 ppb · 28.7% of limitBelow federal MCL
Federal drinking-water comparisons
The official report marks no MCL violation for arsenic, nitrate, or uranium. It separately reports fluoride at 2.43 ppm—below EPA’s 4 ppm primary MCL but above the 2 ppm secondary level that triggers a dental-fluorosis notice for children under nine.
Contaminant
Plainview result
Federal benchmark
Comparison
Arsenic
4 ppb detected
10 ppb MCL
Below limit
Nitrate
2.02 ppm detected
10 ppm MCL
Below limit
Uranium
8.6 ppb detected
30 ppb MCL
Below limit
Municipal supply context: Plainview receives CRMWA surface water from Lake Meredith and Ogallala groundwater from Hutchinson County, and it owns 15 local Ogallala wells. These blended municipal results do not establish the chemistry of the separate monitoring well.
Dallam County, Texas · High Plains Aquifer / Ogallala Formation
Verified 1985–2025 groundwater-level window
Well depth: 298 feet · Record: 31 TWDB-publishable static observations in the 1985–2025 window. A larger depth-to-water value means the water table is farther underground.
TWDB state well 0164301: a 298-foot unconfined Ogallala surveillance well in Dallam County at 36.119722, −103.001111, about 27 miles west of Dalhart. The full agency record spans 1968–2025; this graph uses the requested forty-year window and only rows marked “P — Publishable.” Questionable readings in 2002, 2014, and 2017, pumping/failed visits in 1987, 2013, and 2016, the failed 1990 visit, and years without observations remain gaps. No values or artificial present-day endpoints are invented. Retrieved August 24, 2026.
Government water-quality data · Dalhart Municipal Water System
Dalhart’s official 2025 Consumer Confidence Report identifies the municipal source as groundwater from the Ogallala Aquifer. These system-wide results are not samples from monitoring well 0164301.
Arsenic3 ppb2025 highest level detected · EPA MCL: 10 ppb · 30% of limitBelow federal MCL
Nitrate1.95 ppm2025 highest level detected · EPA MCL: 10 ppm · 19.5% of limitBelow federal MCL
Uranium7.7 ppb2025 highest level detected · EPA MCL: 30 ppb · 25.7% of limitBelow federal MCL
Federal drinking-water comparisons
Contaminant
Dalhart result
Federal benchmark
Comparison
Arsenic
3 ppb detected
10 ppb MCL
Below limit
Nitrate
1.95 ppm detected
10 ppm MCL
Below limit
Uranium
7.7 ppb detected
30 ppb MCL
Below limit
Report context: the 2025 report lists no contaminant MCL violation for these three results. It separately discloses a Consumer Confidence Rule adequacy/availability/content violation from July 1, 2025 through January 28, 2026; that is a reporting violation, not a contaminant exceedance.
Gray County, Texas · High Plains Aquifer / Ogallala Formation
Verified 1985–2025 groundwater-level window
Well depth: 524 feet · Record: 36 TWDB-publishable observations in the 1985–2025 window. The first approved observation inside the window is in 1986; 1985 remains blank. A larger depth-to-water value means the water table is farther underground.
TWDB state well 0533401: a 524-foot unconfined Ogallala surveillance well in Gray County at 35.449167, −100.969722, about six miles south of Pampa. The full agency record extends from 1958 to 2025; this chart uses the requested forty-year window and only rows marked “P — Publishable.” Questionable wet-casing readings in 2000–2001, obstructed-tape readings in 2006 and 2009, oil-marked readings in 2010, the failed wet-casing visit in 2008, and years without observations remain gaps. The NGWMN flags the site as having “Known Changes”; the graph reports the agencies’ approved values, including the 1990–1992 swing, without silently correcting or smoothing them. Retrieved August 24, 2026.
Government water-quality data · City of Pampa
Pampa’s official 2025 Annual Drinking Water Quality Report covers a blended municipal supply from Lake Meredith and Ogallala groundwater in Roberts County and south of the city. These system-wide results are not samples from monitoring well 0533401.
Arsenic3.3 ppb2025 level detected; range 2.1–3.3 ppb · EPA MCL: 10 ppb · 33% of limitBelow federal MCL
Nitrate1.29 ppm2025 level detected; range 1.0–1.29 ppm · EPA MCL: 10 ppm · 12.9% of limitBelow federal MCL
Uranium7.3 ppb2025 level detected; range 7.3–7.3 ppb · EPA MCL: 30 ppb · 24.3% of limitBelow federal MCL
Federal drinking-water comparisons
Contaminant
Pampa result
Federal benchmark
Comparison
Arsenic
3.3 ppb detected
10 ppb MCL
Below limit
Nitrate
1.29 ppm detected
10 ppm MCL
Below limit
Uranium
7.3 ppb detected
30 ppb MCL
Below limit
Official report finding: Pampa states that its drinking water met all federal and state requirements. Its 2025 table marks no MCL violation for arsenic, nitrate, or uranium.
Texas County, Oklahoma · High Plains Aquifer / Ogallala Formation
Verified 1985–2025 groundwater-level window
Well depth: 148 feet · Record: 49 OWRB measurements in the 1985–2025 window. The first observation inside the requested window is in 1986, so 1985 remains blank. A larger depth-to-water value means the water table is farther underground.
OWRB MM9726 · site 9726: a 148-foot unconfined Ogallala well in Texas County at 36.700592, −101.332546, roughly eight miles east of Guymon. The full official record extends from 1966 to 2025; this graph uses the requested forty-year window. Annual winter readings are joined in chronological order, followed by the additional spring and late-summer observations collected in several recent years. The 1985 year remains open because no observation exists, and no artificial endpoint or smoothed forty-year trend is added. Retrieved August 24, 2026.
Government water-quality data · City of Guymon
The latest report currently linked by the City is its 2024 Consumer Confidence Report covering calendar year 2023. Guymon’s municipal supply comes from 18 groundwater wells. These system-wide results are not samples from monitoring well MM9726.
Nitrate-nitrite9.85 ppm2023 highest value; range 3.08–9.85 ppm · EPA MCL: 10 ppm · 98.5% of limitBelow federal MCL
Uranium14.3 ppb2020 highest value; range 8.41–14.3 ppb · EPA MCL: 30 ppb · 47.7% of limitBelow federal MCL
Gross alpha12.4 pCi/LExcluding radon and uranium; 2020 highest value · EPA MCL: 15 pCi/L · 82.7% of limitBelow federal MCL
Federal drinking-water comparisons
Contaminant
Guymon result
Federal benchmark
Comparison
Nitrate-nitrite
9.85 ppm highest
10 ppm MCL
Below limit
Uranium
14.3 ppb highest
30 ppb MCL
Below limit
Gross alpha
12.4 pCi/L highest
15 pCi/L MCL
Below limit
Monitoring notice: the report records a 2023 routine-major nitrate/nitrite monitoring violation because the City did not complete sampling at every pump station within the required calendar-year period. Guymon states that sampling completed March 11, 2024 found every location below the EPA and Oklahoma DEQ MCL and that the scheduling issue was resolved. This was a monitoring violation, not a reported nitrate MCL exceedance.
Beaver County, Oklahoma · High Plains Aquifer / Ogallala Formation
Verified 1985–2025 groundwater-level record
Well depth: 180 feet · Record: 40 official OWRB observations in the 1985–2025 window. Missing 1993 and 2006 measurements remain visible gaps. A larger depth-to-water value means the water table is farther underground.
OWRB site 9080: a 180-foot unconfined Ogallala well in Beaver County at 36.924547, −100.111580, about 24 miles east-northeast of Beaver. The official record begins in 1980 and reaches 2025; this graph uses the requested forty-year window. The NGWMN classifies the site as having “Suspected / Anticipated Changes,” so the graph reports the agency values—including short-term swings—without silently smoothing them. No measurements are invented for 1993 or 2006, and no artificial present-day endpoint is added. Retrieved August 24, 2026.
Government water-quality data · Beaver
Oklahoma DEQ’s official 2026 Consumer Confidence Report covering calendar year 2025 states that Beaver’s municipal supply comes from four groundwater wells. These system-wide results are not samples from monitoring well 9080.
Nitrate-nitrite5.53 ppmFebruary 24, 2025 highest value · EPA MCL: 10 ppm · 55.3% of limitBelow federal MCL
Uranium4.83 ppbMarch 20, 2025 highest value · EPA MCL: 30 ppb · 16.1% of limitBelow federal MCL
Gross alpha3.44 pCi/LExcluding radon and uranium; March 20, 2025 · EPA MCL: 15 pCi/L · 22.9% of limitBelow federal MCL
Federal drinking-water comparisons
Contaminant
Beaver result
Federal benchmark
Comparison
Nitrate-nitrite
5.53 ppm
10 ppm MCL
Below limit
Uranium
4.83 ppb
30 ppb MCL
Below limit
Gross alpha
3.44 pCi/L
15 pCi/L MCL
Below limit
Official report finding: Oklahoma DEQ’s report states that no drinking-water violations occurred during calendar year 2025.
Cimarron County, Oklahoma · High Plains Aquifer / Ogallala Formation
Verified 1985–2025 groundwater-level record
Recorded construction: casing to 179 feet · Record: 38 official OWRB observations in the 1985–2025 window. Missing 2004–2007 measurements remain a genuine graph gap. A larger depth-to-water value means the water table is farther underground.
OWRB MM2275 · site 2275: an unconfined Ogallala well in Cimarron County at 36.689280, −102.330153, about ten miles east of Boise City. The official record begins in 1967 and reaches 2025; this graph uses the requested forty-year window. The NGWMN construction table records casing to 179 feet, while its summary field lists “Well Depth 37 Feet”—a metadata conflict that is incompatible with the published water levels near 140 feet. This profile reports the construction record and agency measurements without inventing a correction. Missing 2004–2007 observations remain open, and no artificial endpoint is added. Retrieved August 24, 2026.
Government water-quality data · Boise City Public Works Authority
Oklahoma DEQ’s official 2026 Consumer Confidence Report covering calendar year 2025 states that Boise City’s municipal supply comes from four groundwater wells. These system-wide results are not samples from monitoring well MM2275.
Arsenic2.4 ppbDecember 23, 2025 highest value · EPA MCL: 10 ppb · 24% of limitBelow federal MCL
Nitrate-nitrite4.48 ppm2025 highest value; range 2.88–4.48 ppm · EPA MCL: 10 ppm · 44.8% of limitBelow federal MCL
1,2-Dichloroethane0.81 ppb2025 highest value; range ND–0.81 ppb · EPA MCL: 5 ppb · 16.2% of limitBelow federal MCL
Federal drinking-water comparisons
Contaminant
Boise City result
Federal benchmark
Comparison
Arsenic
2.4 ppb
10 ppb MCL
Below limit
Nitrate-nitrite
4.48 ppm
10 ppm MCL
Below limit
1,2-Dichloroethane
0.81 ppb
5 ppb MCL
Below limit
Official report finding: Oklahoma DEQ’s report states that no drinking-water violations occurred during calendar year 2025.
Curry County, New Mexico · High Plains Aquifer / Ogallala Formation
Verified 1985–2025 groundwater-level record
Well depth: 337 feet · Record: 30 approved static observations inside the 1985–2025 window. Unmeasured years and readings marked pumping remain genuine graph gaps. A larger depth-to-water value means the water table is farther underground.
USGS 02N.35E.35.21131 4141 131: an Ogallala Formation / High Plains aquifer well in Curry County at 34.360489, −103.240431, about four miles southwest of central Clovis. USGS records a constructed depth of 337 feet. The graph retains only approved static observations; agency readings explicitly qualified as pumping-affected are excluded, and intervals without an approved static reading remain open. The documented endpoints are reported without smoothing, interpolation, or a fitted artificial trend. Retrieved August 24, 2026.
Official water-quality data · EPCOR Clovis
EPCOR’s official 2025 Clovis Water Quality Report presents results from 2025 or the most recent required sampling period within the previous five years. These system-wide municipal results are not samples from USGS monitoring well 342121103142301.
Arsenic5 ppb2023 highest amount; range 2–5 ppb · EPA MCL: 10 ppb · 50% of limitBelow federal MCL
Nitrate4.43 ppm2025 highest amount; range 1.47–4.43 ppm · EPA MCL: 10 ppm · 44.3% of limitBelow federal MCL
Uranium8 ppb2024 result · EPA MCL: 30 ppb · 26.7% of limitBelow federal MCL
Federal drinking-water comparisons
Contaminant
Clovis result
Federal benchmark
Comparison
Arsenic
5 ppb
10 ppb MCL
Below limit
Nitrate
4.43 ppm
10 ppm MCL
Below limit
Uranium
8 ppb
30 ppb MCL
Below limit
Official report finding: EPCOR marked all three results as achieving compliance. The same report separately notes an average fluoride concentration of 2.4 mg/L, above EPA’s 2 mg/L secondary notification level for cosmetic dental fluorosis but below the 4 mg/L primary MCL.
Roosevelt County, New Mexico · High Plains Aquifer
Verified 1985–2025 groundwater-level record
Well depth: 110 feet · Record: 27 approved static observations inside the 1985–2025 window. Unmeasured years and readings marked pumping remain genuine graph gaps. A larger depth-to-water value means the water table is farther underground.
USGS 02S.33E.05.113113 120: a High Plains aquifer well in Roosevelt County at 34.168408, −103.510881, about ten miles west of central Portales. USGS records a constructed depth of 110 feet. The graph retains only approved static observations; readings explicitly qualified as pumping-affected in 2017 and 2023 are excluded. The documented endpoints are reported without smoothing or interpolation, and no artificial forty-year trend is fitted across the genuine gaps. Retrieved August 24, 2026.
Official water-quality data · Portales Water System
The City of Portales’s official report states that municipal water comes from 48 Ogallala Aquifer wells in the Sandhill and Blackwater Draw wellfields. Its table reports 2022 results or the most recent required sampling. These system-wide results are not samples from USGS monitoring well 341002103303001.
Arsenic7 ppb2020 result · EPA MCL: 10 ppb · 70% of limitBelow federal MCL
Nitrate2.99 ppm2022 highest amount; range 2.26–2.99 ppm · EPA MCL: 10 ppm · 29.9% of limitBelow federal MCL
Uranium6 µg/L2020 result · EPA MCL: 30 µg/L · 20% of limitBelow federal MCL
Federal drinking-water comparisons
Contaminant
Portales result
Federal benchmark
Comparison
Arsenic
7 ppb
10 ppb MCL
Below limit
Nitrate
2.99 ppm
10 ppm MCL
Below limit
Uranium
6 µg/L
30 µg/L MCL
Below limit
Official report finding: The City reported no MCL violations for these three contaminants. The same report documents fluoride at 2.71 mg/L—below EPA’s 4 mg/L primary MCL but above the 2 mg/L secondary notification level for cosmetic dental fluorosis in children under nine.